Histograms in photography: understand everything
Last update: 06/22/2026
Our blog continues to grow thanks to you, our readers. This post may contain affiliate links, which means we can earn a small commission if you make a purchase through them, at no extra cost to you. This helps us to continue to bring you more and support our work!
If you have been learning photography for a while, chances are you have already come across the term “histogram“. You may have seen it in photo-editing software such as Photoshop or Lightroom, or directly on your DSLR camera. To understand this slightly more technical article, you will first need to be familiar with the concept of exposure in photography and the elements that make it up: ISO sensitivity, shutter speed and aperture. Why? Quite simply because the histogram of a photo helps you understand your image’s exposure at a glance.
")


You can think of it as a simple, visual way to check the tones of your image in the field, right after taking the shot. Is my photo too dark? Is it overexposed? Is my sky too white? Are the shadows too black? These are exactly the kinds of questions a histogram can answer in a few seconds.
Of course, in the age of digital photography and advanced editing software, you can still make corrections later on your computer. But I still think that, whenever possible, it is better to get things right while shooting. I would much rather focus on my landscape photo while standing in front of a beautiful scene, or on my night photo in the field, than spend time correcting a mistake in post-production that I could have avoided earlier. Wouldn’t you?

What is a histogram and what is it used for?
You can think of a photo’s histogram as its DNA, or almost: a kind of graphic representation of the image. To put it simply, the histogram that appears after you take a photo shows all the tones in that photo. It tells you whether your image contains a lot of bright tones, dark tones, blown highlights that are too white, or shadows that are too dark.
The histogram displays the brightness of your photo on the horizontal axis, from left to right, while the vertical axis represents the number of pixels for each tone. In other words, it already gives you a good indication of your photo’s overall exposure. And to dispel a common myth: no, there is no such thing as a perfect histogram, just as there is no single perfect exposure.


Two photos with very different histograms: one leaning toward the bright tones (left image), the other toward the dark tones (right image)
So yes, it may sound a little abstract when explained like that, but in practice it is a very useful tool. You might be thinking: can’t I just look at the LCD screen of my DSLR to check the exposure of my photo? Yes, you can, but depending on the brightness around you and the brightness setting of your screen, your perception of the photo’s exposure can be misleading. The histogram, however, is not affected in the same way and allows you to see straight away whether your image is overexposed or underexposed. You can then adjust your settings immediately.
How to display the histogram on your camera?
You’re probably wondering how to display this famous histogram on your DSLR. That’s where things become really useful: being able to use it on the spot, while you are out taking photos in the field.
Depending on the type of camera, the histogram may already be more or less visible in the viewfinder. I won’t go into detail about mirrorless and compact cameras here, since they usually allow you to display the histogram in the viewfinder while shooting.
On DSLR cameras, depending on the brand, you usually need to press the INFO or DISP button on the body to make the histogram appear. This button lets you cycle through the different display options on your screen.

Another useful point: depending on your camera, you can enable overexposure or underexposure alerts in the settings. This is another handy tool that warns you when something is wrong with the photo, in other words, when it is simply far too bright or far too dark.
How to read a histogram in photography?
Let’s get to the heart of the matter. How do you read and understand this useful tool? Let’s start with a standard histogram. In general, a histogram is divided into five distinct areas, from left to right:
- The blacks and very dark tones,
- The shadow area,
- The midtones,
- The bright tone area,
- The whites and very bright highlights.

It is fairly easy to understand: the further your histogram moves to the left, the more dark and black tones your photo contains. Conversely, a histogram that leans to the right often represents a photo with many bright tones, even whites.
Once you understand this, you will quickly see that the histogram is also a very good tool for evaluating the contrast in your scene. A high-contrast photo will usually have a histogram that stretches both to the left, toward the blacks, and to the right, toward the whites.
As a general rule, keep in mind that you should avoid taking a photo whose histogram touches the far left or far right edge. Why? Because this usually means that your photo contains either too many blocked blacks, if the histogram is pushed too far left, or too many blown whites, if it is pushed too far right. Pixels in these areas are unrecoverable and no longer contain usable detail. In practice, you see only pure black or pure white, with no shades in between. We’ll come back to this at the end of the article. To make things more concrete, here are a few examples of photos and their associated histograms. If you’re new to photography and want to upgrade to a good entry-level DSLR to start with, have a look here!
An underexposed photo
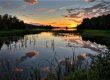
Here is a photo taken during my road trip through the USA and Canada, in Banff National Park. The scene was photographed at sunset, with the sun already behind the mountains. The image is therefore intentionally dark. It is a 10-second long exposure, but that’s not the subject of this article!


The histogram associated with the photo looks like this. A quick analysis clearly shows that most of the image is made up of dark tones, with the histogram pulled strongly to the left. The darkest part of the photo corresponds to the shadows on the lake and the mountains in the background. The forested area appears at the far left of the histogram. You can also see that there is a completely blocked area, black with no detail, especially in the trees. However, there are also brighter tones in the image, corresponding to the brighter area in the center of the photo, where the sunset sits behind the mountains, and to the foreground reflection in the lake.
An overexposed photo
I have to admit that I had to dig through my old photos, from the time when I knew almost nothing about exposure and simply pressed the shutter. Here is a photo from 2006, taken deep in Iceland. As you can see, the background still hurts the eyes because it is so bright. The rest of the photo, however, appears to be properly exposed.

The histogram is fairly typical of a photo with a completely overexposed area. As you can see, part of the histogram is pushed all the way to the right. This represents the completely white area of the image, in this case the sky. This pure white area is unrecoverable and contains no detail. The central peak corresponds to the land area, which does not have much contrast, with few shadows or blacks.

A high-contrast photo
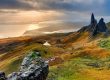
We can say that a photo has strong contrast when bright and dark areas are clearly distinguishable. Here, I’m using the example of a photo taken on the atoll of Rangiroa, where you can see a bright area, with the boat and foreground, as well as a darker area, with the foliage and vegetation.


As you can see in the histogram above, all tones are well represented in the image. There are plenty of shadows and blacks on the left, as well as bright and white tones on the right. The exposure appears correct: no area has lost detail, either in the shadows or the highlights, which means the edges of the histogram are not clipped.
A photo without contrast
Here is a quick example of a very low-contrast photo. The image is flat and lacks detail. Unfortunately, I took this high-altitude boat trip too late in the day, when the light was already very strong and not ideal for photography. For me, the photo simply isn’t very good, even though it does not appear to be either overexposed or underexposed.

The associated histogram shows the typical shape of a low-contrast image, with a peak in the midtones. In fact, there are no truly bright or truly dark areas in the histogram. With digital photography, it is possible to make slight improvements in post-processing, but I tried, and it does not work miracles. The result remains very average.

The same photo: three histograms to compare
I wanted to explain the concept of the histogram using the same image, so you can clearly see the difference. This photo was taken in Grand Teton National Park, in the USA. The central image is the final edited photo, the one that is “correctly exposed.” I deliberately modified the original photo to create the two other versions, on the left and on the right.


If we look at the three images in detail:
- The photo on the left is clearly underexposed. The histogram is stuck to the left and contains very few bright or white tones, with almost nothing on the right side of the histogram.
- The central photo is the final version. You can see that the histogram is much more evenly spread across the full range of tones, from dark tones on the left to bright tones on the right.
- The photo on the right is overexposed. You can see that the histogram is pushed to the right and that part of it touches the right edge, which means some detail has been lost. In this case, certain areas of the image are unrecoverable because they are too white.
Is there a perfect histogram shape?
By now, you should have understood that the histogram only gives information about the exposure of your photo. As I said in the introduction, there is no single correct or ideal exposure. The histogram is there to guide you by showing which tones are more or less present in the image, and above all to help you avoid pushing the exposure too far in one direction or the other, creating black or white areas with no detail. In some situations, you may also deliberately choose to overexpose a photo for a high-key effect, or underexpose it for a low-key effect.
Finally, depending on the shooting conditions, your histogram will not necessarily have a standard or “perfect” shape. I’m thinking in particular of silhouettes, sunsets, concert photos, snow scenes and similar situations.
How to use a histogram in real shooting conditions?
A few final tips on how to actually use the histogram in real shooting conditions. I won’t go so far as to say that you should focus only on this tool. It should remain a decision-making aid, not something that takes over your entire shooting process.
In general, I recommend displaying the histogram on the LCD screen of your DSLR so you can quickly check the photo without having to press the DISP or INFO button after every shot.
Use this tool to quickly review the shot you have just taken. You will need to understand the basics of exposure to know which settings to change if you want to alter the result. For example:
- If you find that your photo is underexposed, you need to adjust your settings to let more light reach your DSLR sensor. If you are using a semi-automatic mode, such as Av on Canon, you can open the aperture by choosing a smaller f-number, increase the exposure time by using a slower shutter speed, or double the ISO sensitivity, for example from ISO 200 to ISO 400. The best choice will depend on your scene and on the creative decision you want to make at that moment. There is no single “right” or “wrong” answer.
- Conversely, if your photo is overexposed, you can lower the ISO by one stop, for example from ISO 800 to ISO 400, use a faster shutter speed, such as going from 1/500 to 1/1000, or close the aperture by choosing a larger f-number.
- You can also try composing the scene differently, which will inevitably change the light intensity and distribution within the frame.

If you are not familiar with the three exposure settings, I’ll refer you to the full article mentioned in the introduction. If the histogram does not give you the result you want, it is essential to understand how the three parameters of the exposure triangle work together so you can change the final look of your photo.
Note that if you shoot with one of the semi-automatic modes, such as Av mode, you usually only need to change one of the three parameters and the camera will adjust the others for you. However, in some situations, the camera may not expose the scene the way you want. That is when learning Manual (M) mode becomes useful.
That is the essential information to remember about the histogram in photography. I hope this article was clear enough and that you now have a better understanding of how useful this tool can be. If you want to keep learning photography, I invite you to explore all the articles covering the basics of photography.
See you soon,

Written by Sylvain PONS
I've been passionate about photography since 2010, learning as I went along. Today, I dedicate myself to guiding others in their choice of camera gear and sharing a variety of tips to improve their photography skills.
Despite our care, a mistake may have slipped into this article. If you find any, please don't hesitate to let us know so we can correct it as soon as possible and keep our information up-to-date!